RTD
From HwB
RTD = Resistive Temperature Device
Common type of RTD is Pt-100, which is a temperature sensor made from platinum. Resistance varies with temperature. 100Ω at 0 °C.
Contents |
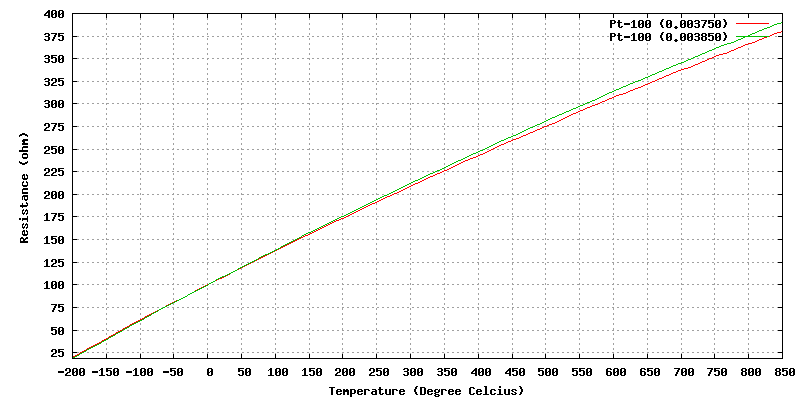
Pt-100
| Temperature | Resistance | |
|---|---|---|
| Pt-100 α=0.003750 °C-1 |
Pt-100 α=0.003850 °C-1 | |
| °C | Ω | Ω |
| -200 | 19.9 | 18.5 |
| -100 | 61.2 | 60.3 |
| 0 | 100 | 100 |
| 100 | 138 | 139 |
| 200 | 174 | 176 |
| 300 | 209 | 212 |
| 400 | 243 | 247 |
| 500 | 275 | 281 |
| 600 | 307 | 314 |
| 700 | 337 | 345 |
| 800 | 366 | 376 |
Callendar-Van Dusen Equation
Given from RTD manufacturer:
Alpha, α
Delta, δ
Beta, β
Calculated from α, δ & β:
A = <math>\alpha + \frac{\alpha \times \delta}{100}</math>
B = <math>-\frac{\alpha \times \delta}{100^2}</math>
C = <math>-\frac{\alpha \times \beta}{100^4}</math>
Given:
RT = Resistance (Ω) at T°C
R0 = Resistance (Ω) at 0°C (100 Ω for Pt-100)
T = Temperature in °C
Calculated
| RT = R0 x (1 + A x T + B x T² + (T-100 °C) x C x T³) | for T < 0 °C |
| RT = R0 x (1 + A x T + B x T²) | for T > 0 °C |
Callendar-Van Dusen Constants
Constants
The purity of the metal will determine the constants.
| Given | Calculated | ||||
|---|---|---|---|---|---|
| Alpha, α | Delta, δ | Beta, β | A | B | C |
| °C-1 | °C | °C | °C-1 | °C-2 | °C-4 |
| 0.003750 | 1.605 | 0.16 | 0.381 x 10⁻³ | -6.02 x 10⁻⁷ | -6.0 x 10⁻¹² |
| 0.003850 | 1.4999 | 0.10863 | 3.908 x 10⁻³ | -5.775 x 10⁻⁷ | -4.183 x 10⁻¹² |
| 0.003902 | 1.52 | 0.11 | 3.96 x 10⁻³ | -5.93 x 10⁻⁷ | -4.3 x 10⁻¹² |
| 0.003911 | 3.9692 × 10⁻³ | –5.8495 × 10⁻⁷ | –4.233 × 10⁻¹² | ||
| 0.003916 | 3.9739 × 10⁻³ | –5.870 × 10⁻⁷ | –4.4 × 10⁻¹² | ||
| 0.003920 | 3.9787 × 10⁻³ | –5.8686 × 10⁻⁷ | –4.167 × 10⁻¹² | ||
| 0.003928 | 3.9888 × 10⁻³ | –5.915 × 10⁻⁷ | –3.85 × 10⁻¹² | ||
Alpha, &alpha, is sometimes known as TCR
0.003850 is according to IEC 751-2 (ITS90) standard. Made from 99.99% pure platinum.
Typical data
| Standard | Typical data | ||
|---|---|---|---|
| α | Tolerance | R0 | |
| BS EN 60751 1996 | 0.003850 °C-1 | ±0.05%, ±0.03%, ±0.02%, ±0.01% | 100 Ω |
| DIN 43760 1980 | 0.003850 °C-1 | ±0.05% (1/2 DIN B), ±0.03% (1/3 DIN B), ±0.02% (1/5 DIN B), ±0.01% (1/10 DIN B) | 100 Ω |
| IEC 751 1995 | 0.003850 °C-1 | ±0.05%, ±0.03%, ±0.02%, ±0.01% | 100 Ω |
| JIS C1604 - 1981 (Japanese Industrial Standard) | 0.003916 °C-1 | ±0.15ºC, ±0.2ºC, ±0.5ºC | 100 Ω or 50 Ω |
| US Standard Curve | 0.003916 °C-1 | ±0.1 ohms | 100 Ω or 50 Ω |
| BS 2G 148 (British Aircraft Industry) | 0.003900 °C-1 | ±0.1% (at 0ºC) | 130 Ω |
Graph
Temperature vs Resistance

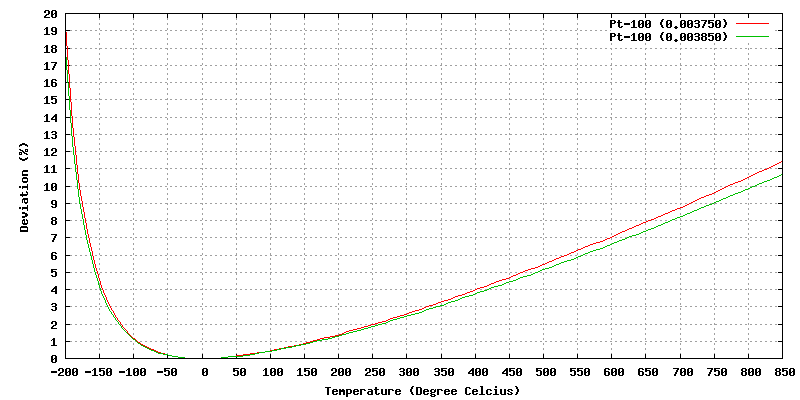
Non linearity
This graph shows the affect of B & C in the Callendar-Van Dusen equation. Percentage error if the RTD would have been assumed to be linear.

Standards
- IEC 751:1995
- BS EN 60751 1996
- DIN 43760 1980
- BS 2G 148
Sources
- Thermal Developments International Ltd.: Hand made platinum resistance temperature detectors
- Honeywell - Sensing and Control: Reference and Application Data - Temperature Sensors Platinum RTDs
- Pentronic: Platinum resistance thermometers